Overview
The Sales Trend Chart Report provides a visual breakdown of your sales performance over time.
This report helps you track growth patterns, seasonal fluctuations, and overall revenue trends across your catering business. Use this report to monitor long-term performance, compare time periods, and make data-driven decisions about marketing, staffing, and inventory planning.

Accessing the Report
Go to the More tab in your CaterZen account.
Select Reports → Sales Reports.

Click Sales Trend Chart Report.
Choose your Filter Parameters (see below).
Click Generate Report.
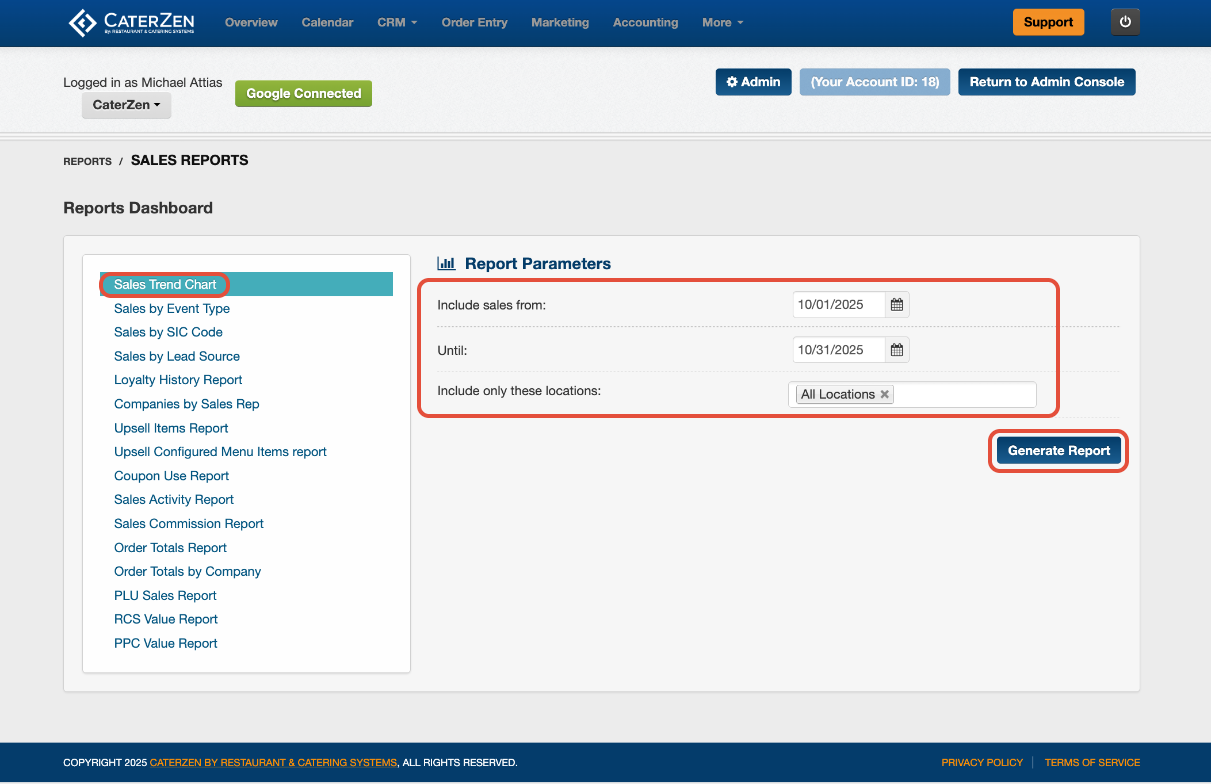
Filter Parameters
Use these filters to define the scope of your sales data:
Date Range – Select the time frame to analyze (daily, weekly, monthly, or quarterly).
Location – Choose one or multiple store locations to include.
Exporting or Sharing
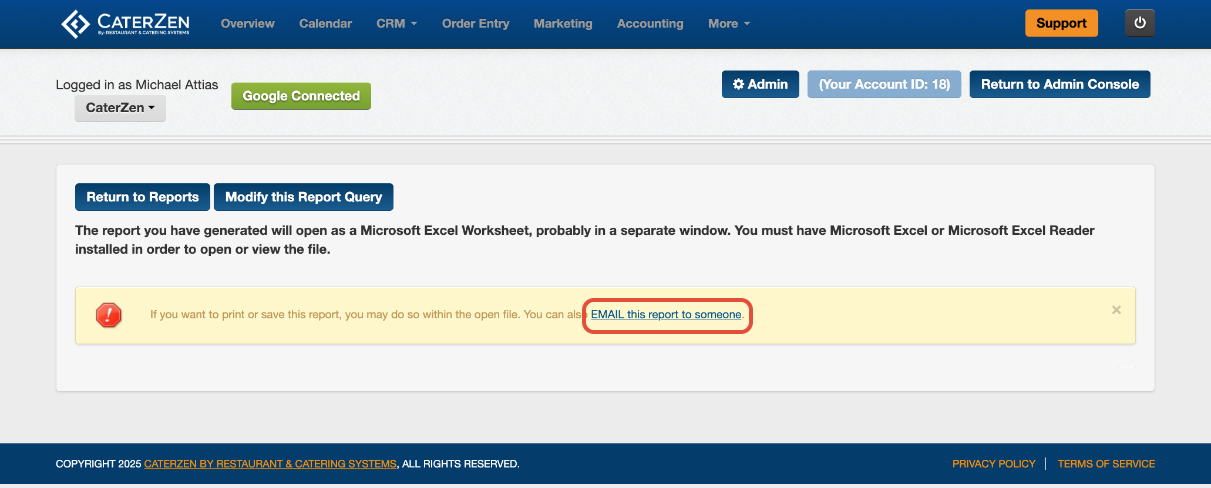
The report automatically downloads as an Excel file when generated.
You can also email the report directly to yourself or another team member.
Once exported, you can view the chart in Excel or use the data to create visual dashboards and custom graphs.
Understanding the Report
The exported report includes both raw sales data and a visual trend chart, which graphically represents your total sales over the selected period.
You’ll see columns and data points for:
Date Range (Tabs for Daily, Monthly and Yearly)
Total Sales by Location
The chart automatically plots sales volume over time, helping you identify upward or downward trends in catering performance.

Common Use Cases
Trend Tracking: Compare monthly or quarterly sales to spot growth or slow periods.
Seasonal Forecasting: Use historical data to anticipate busy catering seasons.
Multi-Location Comparison: Identify which locations are trending up or down in performance.
Performance Review: Track company-wide sales growth or individual rep performance over time.
Best Practices
Run this report monthly to monitor ongoing growth and detect early signs of sales decline.
Use it in management meetings to visualize performance rather than relying on numerical reports alone.
Combine it with the Order Totals Report for a detailed breakdown behind each period’s numbers.
Export multiple periods (e.g., quarterly) to compare historical growth year-over-year.
Related Articles
Support
For additional help, refer to the CaterZen Support Center or contact our CaterZen Support Team.
Not a CaterZen customer yet? Discover how our catering software can streamline your business — click here to learn more!